


~224koz added at only A$16/oz; Barton total JORC Resources now ~1.5Moz
ADELAIDE, AUSTRALIA / ACCESSWIRE / June 14, 2024 /
HIGHLIGHTS
- Tunkillia JORC Mineral Resources increase to 1.38 million oz (46.3Mt @ 0.93 g/t Au), with 224,000 oz Au added for an ‘all in' cost of only AUD ~$16 / oz
- Attractive characteristics:
- 794koz Au of Tunkillia Project Resources are classified in the JORC ‘Indicated' category (~58%)
- 277koz Au in shallow supergene zone starting from ~35m depth
- ~80% of Resource tonnes and ounces are within 200m of surface; and
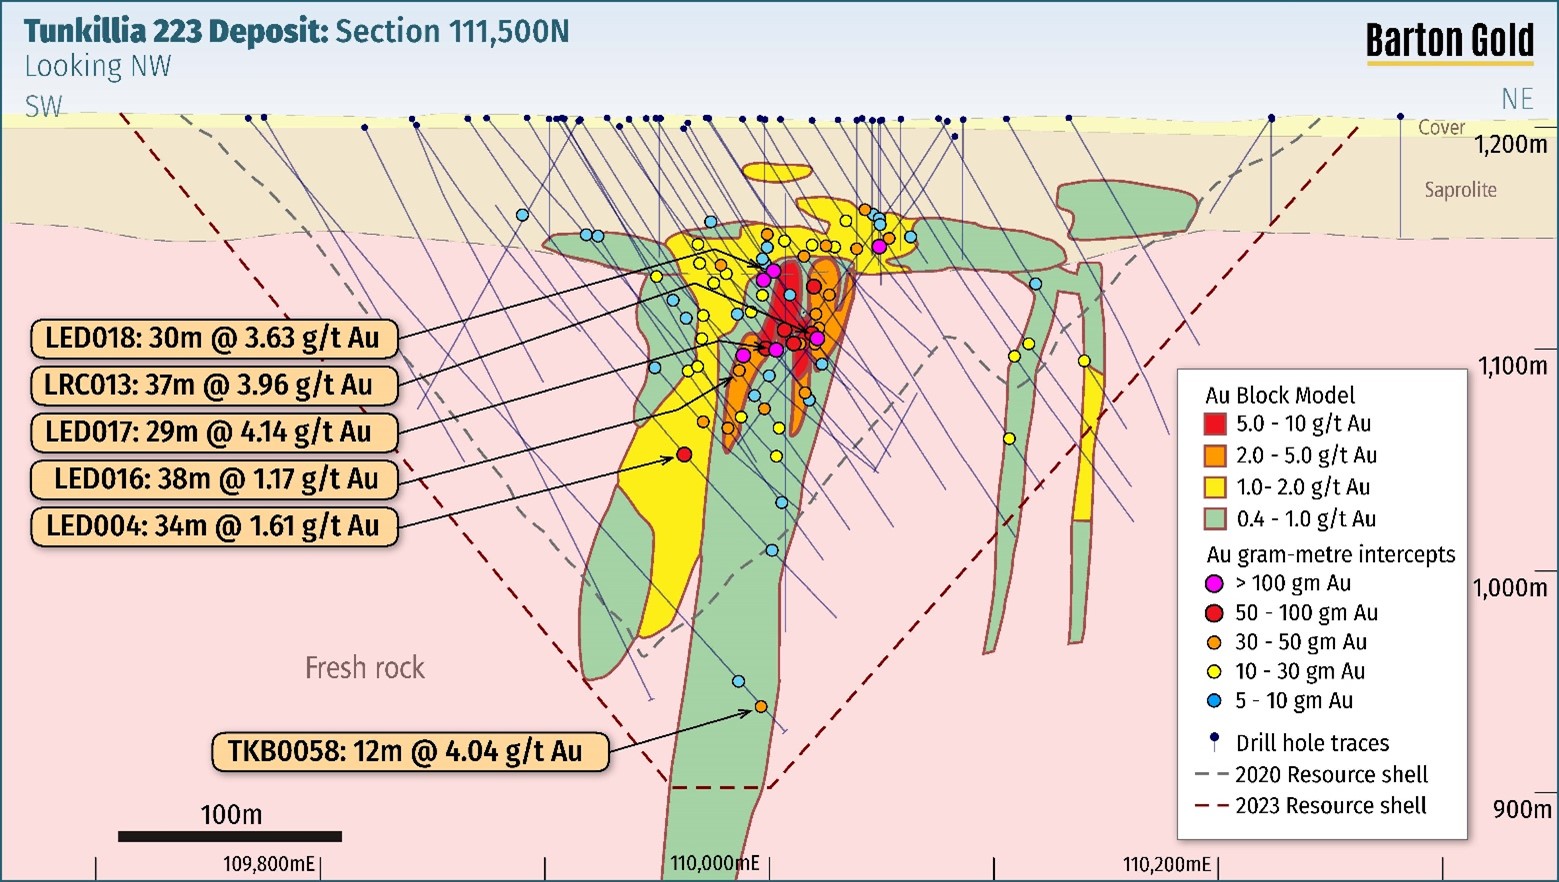
- 300m long higher-grade zone located in the centre of the 223 Deposit
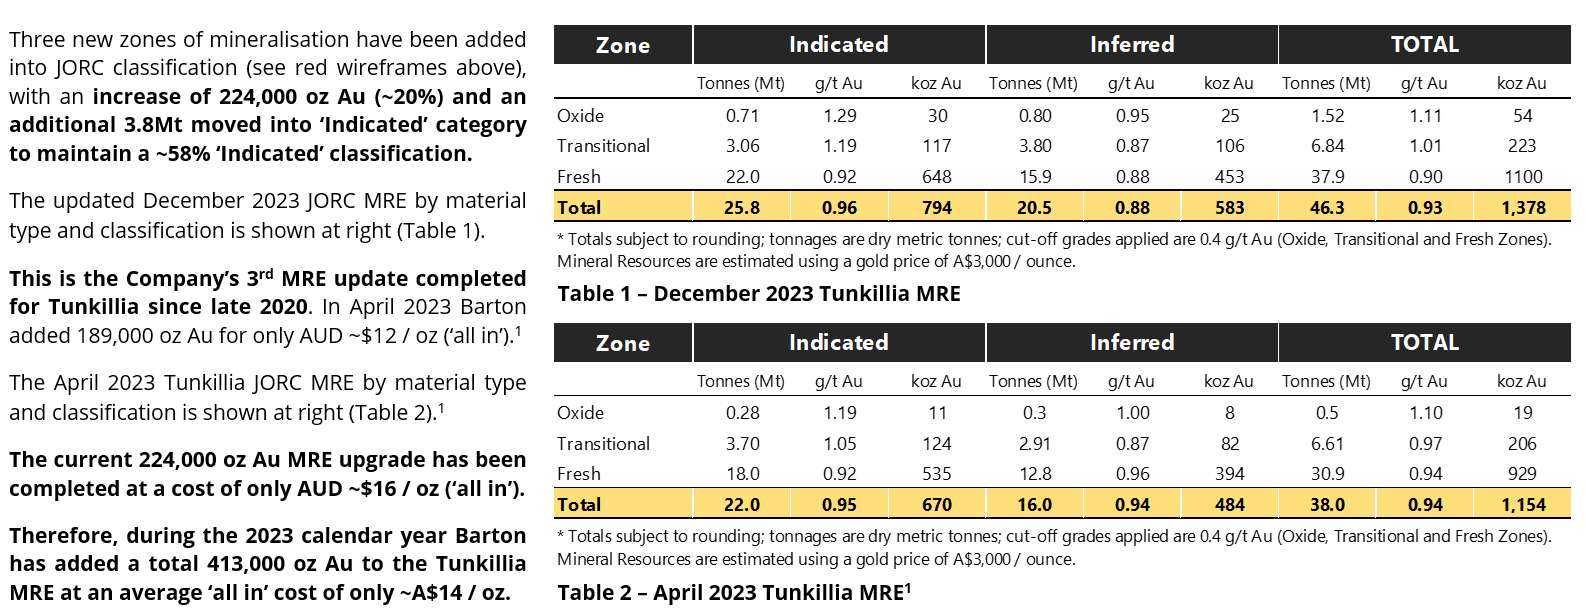
- Upgraded Tunkillia MRE includes:
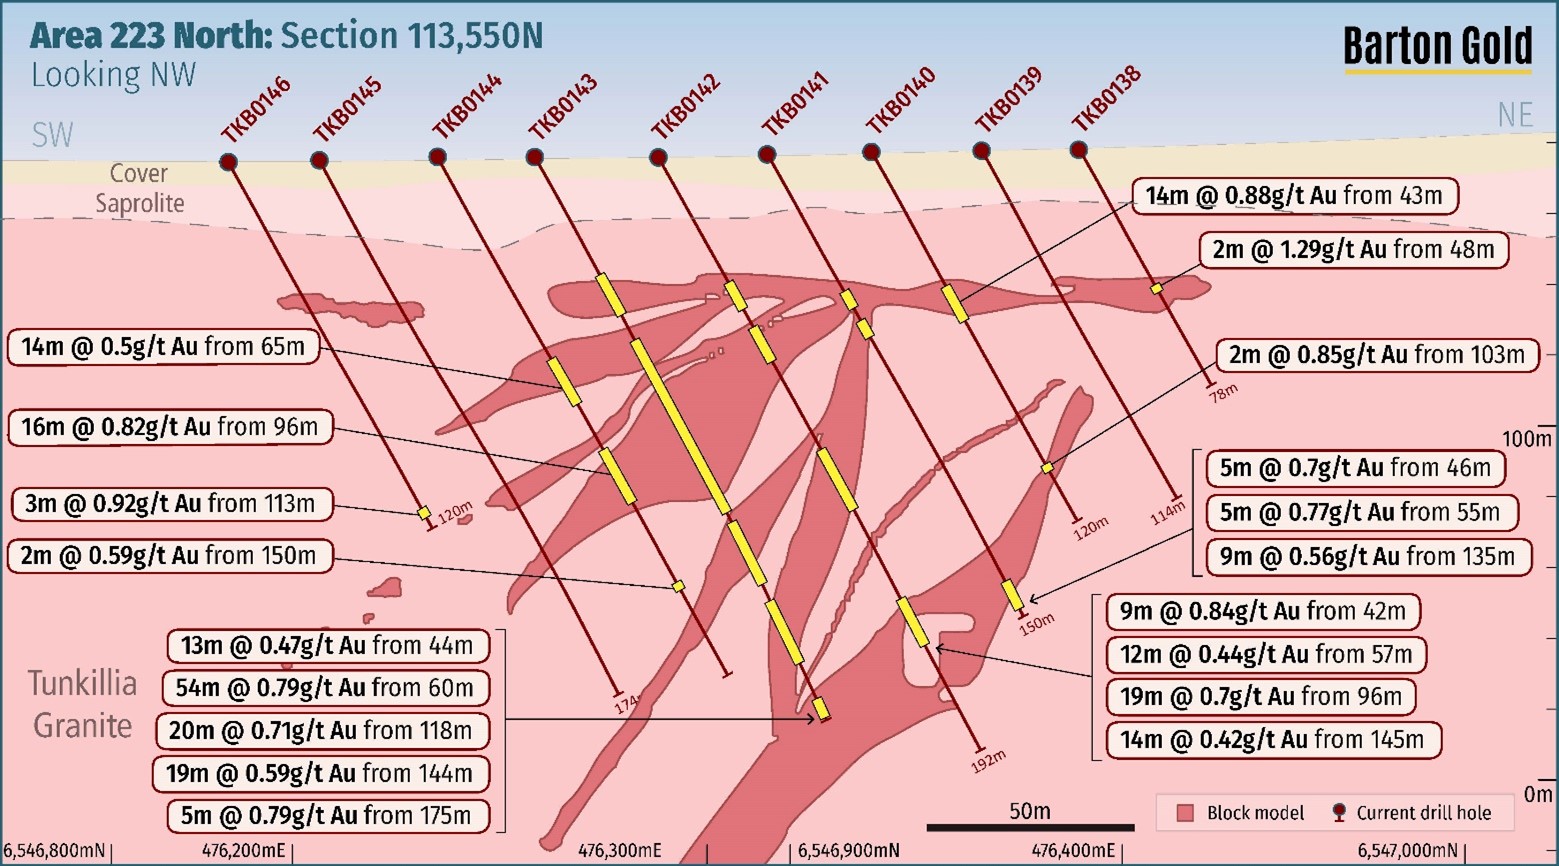
- 223 Deposit extensions, a new southern gold zone, and ‘Area 223 North' converted to MRE
- +22% total tonnes (+8.3Mt) and +20% total Au metal (+224koz)
- +80% Resource strike (from ~2km to ~3.5km)
- Conservatively modeled with a production mentality; tight grade capping and internal dilution targeting efficient, bulk open pit operations and strong metal reconciliation
- Near-term exploration upside, with Area 51, Area 191, and SE Offset assays pending
- Barton total JORC Mineral Resources increase to 1.46 million oz (47.2Mt @ 1.0 g/t Au), with 413,000 oz Au added during 2023 for an average ‘all in' cost of only AUD $14 / oz
Barton Gold Holdings Limited (ASX:BGD)(FRA:BGD3)(OTCQB:BGDFF) (Barton or the Company) is pleased to announce an updated JORC Mineral Resources Estimate (MRE) for the Tunkillia Gold Project (Tunkillia).
Approximately 15,200m of drilling has added ~224,000 oz Au in the cornerstone 223 Deposit and the 223 North satellite gold zone for an estimated ‘all in' cost of ~A$16 / new ounce. Total Tunkillia Mineral Resources are now 1.38Moz Au (46.3Mt @ 0.93 g/t Au), with ~58% classified in the ‘Indicated' category.
Commenting on the latest Tunkillia JORC Resources update, Barton MD Alex Scanlon said:
"This is the second time that Barton has grown the Tunkillia Project's JORC Resources during 2023, with a total of 413,000 ounces of gold added at an exceptionally low ‘all in' cost of only A$14 per ounce. These results continue to validate the Company's exploration thesis for Tunkillia, with its mineral footprint rapidly expanding.
"We look forward to sharing another ~8,000m of assays from target Areas 51, 191 and SE Offset in early 2024."
Updated Tunkillia JORC Mineral Resource Estimate (MRE)
An updated Tunkillia plan map showing the updated December 2023 MRE outlines, and regional targets Area 51, Area 191 and SE Offset, is shown at Figure 1 below. The updated Tunkillia MRE includes a northern extension of the 223 Deposit, a new offset zone of mineralisation proximal to its southern extent of the 223 Deposit (Southern 223), and the conversion of the 223 North gold zone into JORC classification.
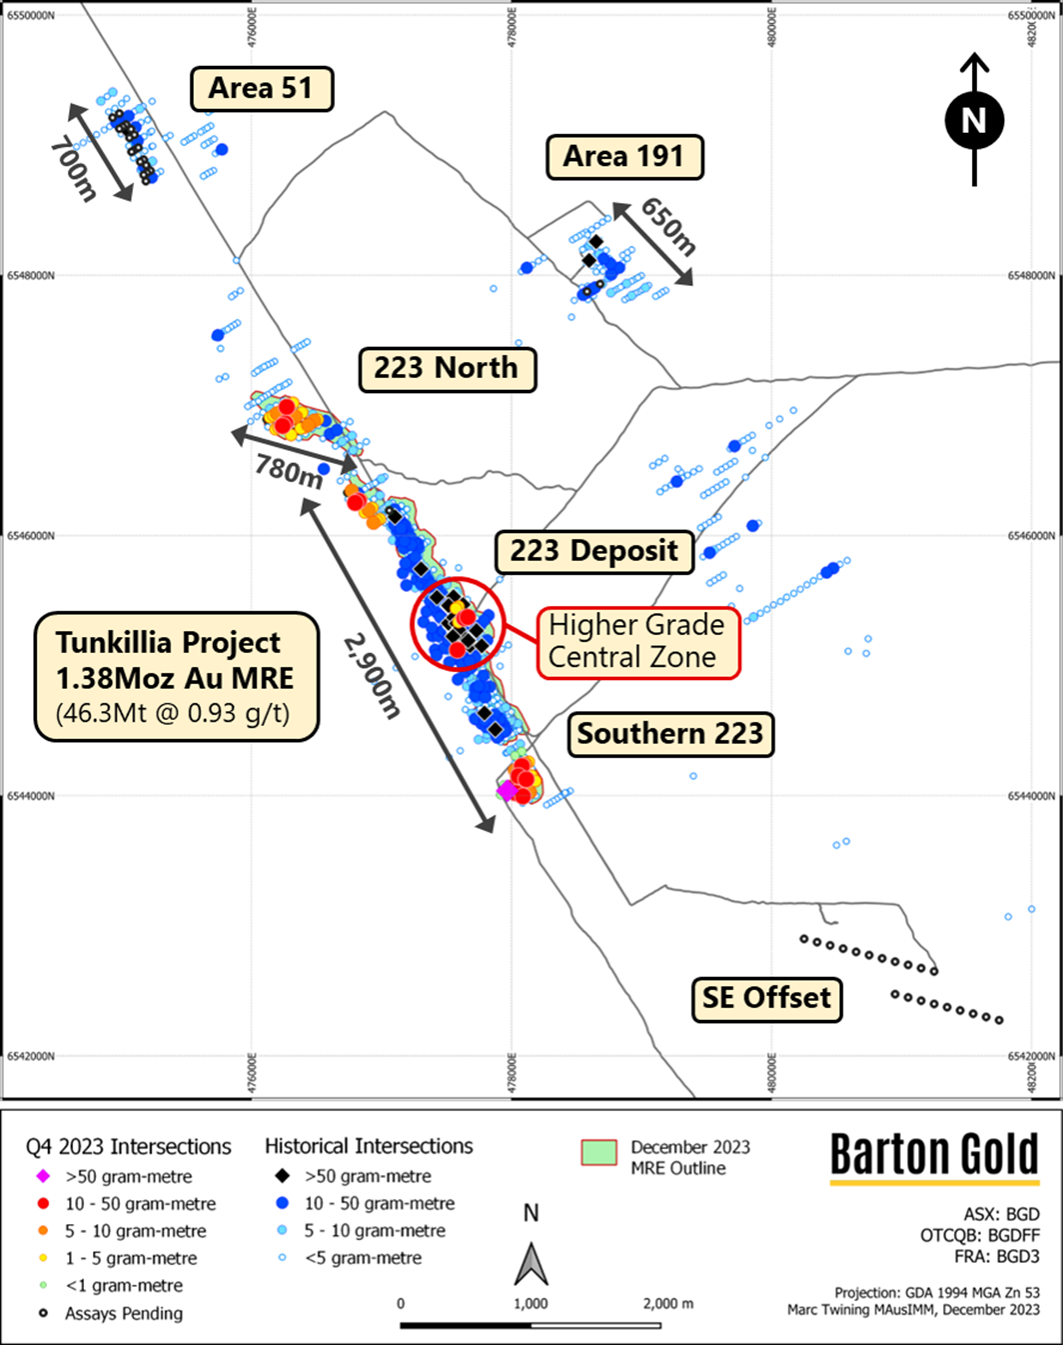
Updated Tunkillia JORC Mineral Resource Estimate (MRE)
The updated JORC MRE for the Tunkillia Gold Project is now 1.38 Million ounces gold (46.3Mt @ 0.93 g/t Au), as reported in accordance with JORC (2012).
Background & additional information
Barton acquired Tunkillia in December 2019 as a 558koz Au deposit with the view that Tunkillia had significant growth potential due to limited historical exploration during a period of low gold prices. Around 77% of all Tunkillia drilling was completed from 1996 to 2005 (USD gold below $400/oz), with another ~8% from 2005 to 2008 (USD gold average price ~$650/oz).
As a result, approximately 85% of all historical drilling was therefore completed with a weighted average gold price below USD $425/oz, and was on average very shallow. Barton has since confirmed multiple Tunkillia depth extensions and three new gold zones at Areas 223 North, 191, and 51, with three JORC MRE updates. 1
In November 2021 Barton confirmed the central zone of the 223 Deposit as a higher-grade priority development target area.2 In April 2023 the 223 Deposit MRE was upgraded from 965koz Au (26.1Mt @ 1.15 g/t Au) to 1.15Moz Au (38Mt @ 0.94 g/t Au) via significant depth extensions of 50 - 150m in three key target zones.3
This MRE update adds ~800m of mineralisation into JORC classification in northern and southern zones proximal to the 223 Deposit, plus a further ~780m into JORC classification within the ‘223 North' satellite gold zone. A total ~8.3Mt and ~224,000 new ounces have been added for an estimated ‘all in' cost of only ~ A$16 / oz with 89 RC holes (15,189m) completed at an estimated ‘all in' cost of A$3.6m (including drilling, assays, logistics, labour, and Native Title costs).
New drilling in MRE
The updated 223 Deposit MRE has been informed by 89 new RC holes totalling 15,189 metres of drilling.
Strong return on investment
- 3 new zones converted to MRE
- $3.6m estimated ‘all in' cost
- AUD ~$16 ‘all in' cost / new ounce
- 14.75 oz growth / metre drilled
Attractive characteristics
- 794koz Au of updated MRE in the JORC ‘Indicated' category (~58%)
- 277koz Au in shallow (~35m depth) supergene blanket
- Higher-grade 300m core with broad (40 - 80m) mineralisation
- ~80% of MRE tonnes and ounces located within 200m of surface

The 223 Deposit MRE has been modeled for potential development as a bulk open pit operation targeting efficiencies of scale and strong grade reconciliation. Tight grade capping and more internal dilution therefore yield a higher confidence and lower-risk model for future investment. The 223 Deposit also has a broad, ~300m long higher-grade corewith potential to enhance early project economics.
New northern and southern mineralised zones
Recent Tunkillia drilling was designed to target potential northern and southern extensions beyond the 223 Deposit in areas not previously tested due to low historical gold prices and limited investment. A lack of drilling accurately targeting new extensions or zones of mineralisation along strike was suggested by the Company's geophysical modelling. Drilling completed during September and October 2023 confirmed extensive new mineralisation at the 223 Deposit in a northern extension, the new Southern 223 gold zone, and the previously identified ‘223 North' satellite gold zone.7

Updated JORC Mineral Resources Statement*
Further to the updated MRE detailed in this announcement for Tunkillia's 223 Deposit, its new northern extension, and the Southern 223 and 223 North zones, Barton's total attributable JORC (2012) Mineral Resource endowment has grown by approximately 18% to a total 1,459koz Au (47.2Mt @ 1.0 g/t Au).9
Please refer to the table depicted below in Figure 7 for full details of the MRE for each project.

* Table shows complete JORC Mineral Resources Estimate (MRE) for each Project on a 100% basis. Figures subject to rounding; tonnages are dry-metric tonnes; all Mineral Resources classified as ‘inferred' are approximate; cut-off grades applied are 0.4 g/t Au (Tunkillia), 0.4 g/t Au (Tarcoola), 2.0 g/t Au (Challenger).
Mineral Resource Estimation Methodology and Data
The following information is provided as an addendum and meets the requirements under ASX Listing Rule 5.8.1. This information is provided in detail in the attached JORC Table 1 (Appendix 2)
The Tunkillia deposit is a Proterozoic-aged shear hosted gold system located in the central Gawler Craton region of South Australia. The deposit lies within the regional-scale Yarlbrinda shear zone which represents the boundary between several major crustal domains. The deposit has dimesions of approximately 2km along a north north-westerly strike, with primary zones of mineralisation having a steep west south-westerly dipping orientation. Higher grade zones of mineralisation are primarily hosted within multiple zones of quartz veins, within a broader zone of lower grade gold mineralisation. A signficant zone of flat lying gold mineralisation occurs at the base of weathering above fresh rock. No hisotrical mining or prospecting has taken place at the deposit.
Drilling Techniques
A total of 616 RC and diamond drill holes for 105,086 m have been drilled within the area defined by the Tunkillia mineral resource. 564 of these holes are RC (94,508 m) with 52 holes (10,577 m) being either diamond or pre-collared diamond. Barton Gold's drilling since 2020 comprises 33,806 m RC (173 holes) and 2,164 m pre-collared diamond drilling (10 holes). RC drilling for Barton Gold was undertaken by Bullion Drilling Pty Ltd using a Schramm T865 rig, Kenndy Drilling using a custom made SR650 and Egan drilling supplied a track mounted Sandvik 400 series, all RC rigs had on-board compressors with an auxiliary booster to provide approximately 2000 cfm by 1000psi air capacity. Diamond drilling completed by Resolution Drilling using a UDR1200 rig.
Drill holes across the deposit are spaced at nominal 50 m x 50 m centres, and commonly infilled to 25 m centres. Pierce point intersections are similarly achieved at 50 m vertical centres, within infill to nominal 25 m centres in selected areas.
The locations of historical drill holes have been verified by Barton Gold with both surface drill collar pick-ups and by validation of existing mineralisation with recent infill drilling. Since the March 2023 resource 89 new RC holes totalling 15,189 metres of drilling have been added to the drill hole database.
Sampling and Sub-sampling Techniques
Barton Drilling
RC drilling by Barton Gold utilised a 5 ¾" face-sampling hammer, with a rig-mounted Metzke cone splitter attached to the cyclone providing one-metre sample intervals. Field duplicates were collected at the ratios of either 1:16, 1:22 or 1:50. Certified referenece materials (CRMs) sourced from OREAS were inserted with grade ranges suited to grade populations for the deposit.
Diamond drilling by Barton Gold utilised NQ-size drill core, with half-core submitted for analysis. Intervals were generally one metre in length and adjusted where appropriate to reflect geological boundaries. Field duplicates were derived by quarter-coring intervals. Identical field duplicate and CRM protocols as RC drilling were used.
Historical Drilling
Historical drilling (pre-Barton) undertaken at the project employed drilling and sampling protocols similar to Barton Gold's approach and are considered suitable for resource estimation purposes.
Sample Analysis Method
2-4kg RC splits and half-drill core were sent to Bureau Veritas in Adelaide for preparation and analysis using 40g fire assay techniques for gold. Bureau Veritas' FA1 method uses a 40g lead collection fire assay with an AAS finish to a 0.01 ppm detection limit. Samples from an earlier phase of Barton Gold drilling were sent to Intertek Genalysis in Adelaide for preparation and analysis using 50g fire assay techniques for gold and ICPOES/MS for multielement geochemistry
A variety of analytical techniques and laboratories have been utilised over the course of the project's history and are considered suitable for resource estimation purposes.
QAQC
Barton Gold inserted certified reference materials (CRM's) supplied by OREAS into the sampling sequence every 50 samples. CRM's were selected on the basis of gold levels relevant to the deposit being drilled. Barton Gold's overall QAQC protocols utilised CRM's, field duplicates and certified coarse blank inserted at an overall ratio of one per 50 routine drill hole samples for both RC and diamond drilling.
Based on the results of standard analysis, in addition to the internal QA/QC standards, repeats, and blanks run by the laboratory, the laboratory was deemed to provide an acceptable level of accuracy and precision.
Estimation Methodology
The geological interpretations are based on drill hole data: there is no outcrop in the area covering the deposit. Drill core and RC chip logging has been used to define the main geological units and weathering profile boundaries.
Mineralisation above the base of weathering is assumed to be affected by supergene or weathering effects and is interpreted as dominantly horizontal lenses. Fourteen fresh rock mineralized structures were interpreted, based on continuity of grade at a lower cut-off of 0.25 g/t Au at the Tunkillia 223 deposit. One small high-grade domain was defined based on a lower cut-off of 2.0 g/t Au. Three structures were interpreted at Southern 223, and five structures were interpreted at a lower cut off of 0.25 g/t at Area 223 North. Structures were grouped into geostatistical domains based on grade similarities and structural orientation. Tunkillia (223) and Southern 223 strike grid (local) north-south and dip steeply west. Two post-mineralisation mafic dykes and one dacite dyke were modelled and the resulting volumes were assigned zero grade. Area 223 North strikes grid NNW (local) and dip moderately to WSW.
The Mineral Resource statement reported herein is a reasonable representation of the Tunkillia 223, Area 223 North and Southern 223 deposits based on current sampling data. Grade estimation was undertaken using Geovia's Surpac™ software package (v7.6.3). Ordinary Kriging ("OK") was selected for grade estimation.
The block model utilises parent blocks measuring 10 m x 20 m x 5 m with sub-blocking to 1.25 m x 2.5 m x 1.25 m (XYZ) to better define the volumes. Blocks above topography are flagged as air blocks. Estimation resolution was set at the parent block size.
Informing samples were composited down hole to 2 m intervals. Grade capping was applied to outlier composites. Experimental variograms were generated where possible in LeapFrog. For domains where experimental variograms could not be created, variogram models were borrowed from similar domains. A two-pass estimation process was employed, the first pass (80 m search) required a minimum of 12 samples and a maximum of 20 composites, the second pass (160 m search) required a minimum of 6 composites and a maximum of 16 composites. Density values are assigned to blocks based on lithology and weathering; the average density of the mineralisation is 2.67 t/m3.
Block model validation consisted of visual checks in plan and section, global comparisons between input and output means, alternative estimation techniques.
Cut-off Grades
The resource is reported above a 0.4 g/t gold grade and within 300 m of the surface (900mRL). The following assumptions were considered:
Resource Cut Off Assumptions | ||
Item | Units | Value |
Gold Price | AUD$/oz | $3,000 |
Gold Price | AUD$/g | $96.45 |
Recovery | % | 95% |
Effective Revenue | AUD$/g | $91.63 |
Less Royalty | % | 6.0% |
Less per g Costs | AUD$/g | $0.96 |
Realized Revenue | AUD$/g | $86.08 |
Cost to Mine/t ore | AUD$/t | $18.79 |
Costs to Process | AUD$/t | $14.00 |
Cut-off (in place) | g/t | 0.39 |
Dilution | % | 5% |
Resource Cut-off Grade | g/t | 0.40 |
Resource Classification Criteria
The Resource Estimates were classified in accordance with the JORC 2012 code. The 223 North, Tunkillia 223 and 223 south resources are classified based on data quality, drill density, number of informing samples, kriging efficiency, average distance to informing samples and vein consistency (geological continuity). Geological continuity has been demonstrated at 50m grid spacing over the entire strike of the deposits. Areas of high grade or geological complexity have been infilled to 25m grid centres. Areas drill on 50m sections infilled on 25m centres, and proximal areas with sparser drill density (50 x 50m) may be classified as Indicated, predicated on geological confidence. Areas of 50m x 50m or greater have been classified as Inferred. Areas of limited geological confidence or at a depth beyond a reasonable open pit depth remains unclassified. A mineral resource is not an ore reserve and does not have demonstrated economic viability.
Mining and Metallurgical Methods and Parameters
Barton Gold foresees mining via open pit and heap or conventional grinding and leach recovery. MA notes that this is a reasonable assumption but should not be regarded as rigorous at this stage of the project. The current Mineral Resource does not include any dilution or ore loss associated with practical mining constraints. The Tunkillia 223 mineralisation sampled has been shown to be amenable to direct cyanidation for gold extraction. Limited metallurgical work shows moderate recovery differences between oxidised and fresh material. Gold recoveries within the oxidised material are between 92 and 97%.
Authorised by the Board of Directors of Barton Gold Holdings Limited.
For further information, please contact:
| Alexander Scanlon Managing Director [email protected] +61 425 226 649 | Shannon Coates Company Secretary [email protected] +61 8 9322 1587 |
1 Refer to ASX announcement dated 26 April 2023
2 Refer to Prospectus and ASX announcements dated 3 / 8/ 15 November 2021, 5 Sep 2022, and 19 / 26 April 2023
3 Refer to ASX announcement dated 15 Nov 2021
4 Refer to ASX announcement dated 26 April 2023
5 Intersections are broadly representative of mineralisation in these parts of the deposits
6 Refer to ASX announcement dated 26 April 2023; intersections are broadly representative of mineralisation in this part of the deposit
7 Refer to ASX announcements dated 15 and 21 November 2023
8 Intersections are broadly representative of mineralisation in this part of the deposit; refer to ASX announcements dated 15 and 21 November 2023
9 Growth is net of earlier ~61.4koz reduction from withdrawal from Western Gawler Craton JV since last JORC Mineral Resources update (26 April 2023);; refer to ASX announcement dated 1 September 2023
Competent Persons Statements
The information in this announcement that relates to Exploration Results for the Tunkillia Gold Project (including drilling, sampling, geophysical surveys and geological interpretation) is based upon, and fairly represents, information and supporting documentation compiled by Mr Marc Twining BSc (Hons). Mr Twining is an employee of Barton Gold Holdings Ltd and is a Member of the Australasian Institute of Mining and Metallurgy Geoscientists (AusIMM Member 112811) and has sufficient experience with the style of mineralisation, the deposit type under consideration and to the activity being undertaken, to qualify as a Competent Person as defined in the 2012 Edition of the "Australasian Code for Reporting of Exploration Results, Mineral Resources and Ore Reserves" (The JORC Code). Mr Twining consents to the inclusion in this announcement of the matters based upon this information in the form and context in which it appears.
The information in this announcement that relates to the estimate of Mineral Resources for the Tunkillia Gold Project geological interpretation and resource estimates) is based upon, and fairly represents, information and supporting documentation compiled by Mr Ian Taylor BSc (Hons). Mr Taylor is an employee of Mining Associates Pty Ltd and has acted as an independent consultant on Barton Gold's Tunkillia Gold Project, South Australia. Mr Taylor is a Fellow and certified Professional of the Australian Institute of Mining and Metallurgy (FAusIMM (CP Geo) 110090) and has sufficient experience with the style of mineralisation, the deposit type under consideration and to the activity being undertaken, to qualify as a Competent Person as defined in the 2012 Edition of the "Australasian Code for Reporting of Exploration Results, Mineral Resources and Ore Reserves" (The JORC Code). Mr Taylor consents to the inclusion in this announcement of the matters based upon this information in the form and context in which it appears.
About Barton Gold
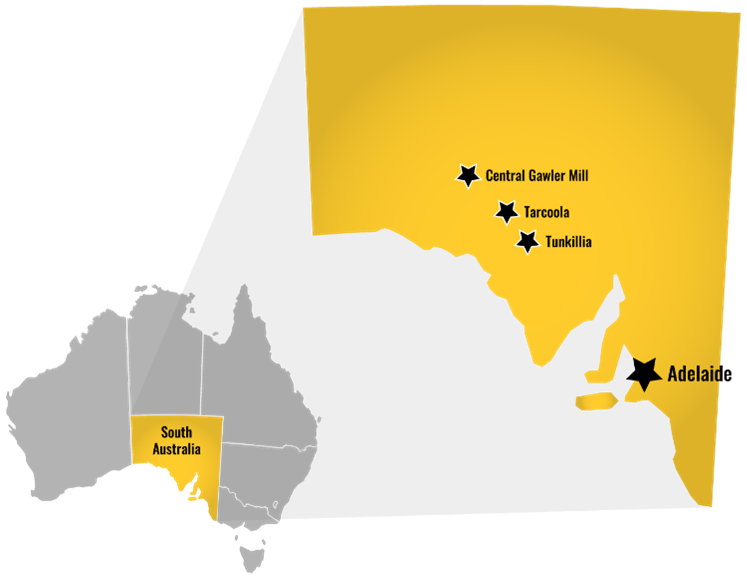
Barton Gold is an ASX listed Australian gold exploration company with a total attributable 1.3Moz Au JORC Mineral Resources endowment (40.6Mt @ 1.0 g/t Au), a pipeline of advanced exploration projects and brownfield mines, and 100% ownership of the only regional gold mill in the central Gawler Craton of South Australia.*
Tarcoola Gold Project
- Existing brownfield open pit mine within trucking distance of Barton's processing plant
- Under-explored asset with untapped scale potential
Tunkillia Gold Project
- 1.15Moz Au Mineral Resources (38Mt @ 0.94 g/t Au)*
- District-scale structures with advanced satellite targets
Infrastructure
- 650ktpa CIP process plant, mine village, and airstrip
- Tarcoola ~40 person lodging to support mine operations
- Tunkillia camp to support dedicated project team
Competent Persons Statement & Previously Reported Information
The information in this announcement that relates to the historic Exploration Results and Mineral Resources as listed in the table below is based on, and fairly represents, information and supporting documentation prepared by the Competent Person whose name appears in the same row, who is an employee of or independent consultant to the Company and is a Member or Fellow of the Australasian Institute of Mining and Metallurgy (AusIMM), Australian Institute of Geoscientists (AIG) or a Recognised Professional Organisation (RPO). Each person named in the table below has sufficient experience which is relevant to the style of mineralisation and types of deposits under consideration and to the activity which he has undertaken to quality as a Competent Person as defined in the JORC Code 2012.
Activity | Competent Person | Membership | Status |
| Tarcoola Mineral Resource | Dr Andrew Fowler (Consultant) | AusIMM | Member |
| Tarcoola Exploration Results (until 15 Nov 2021) | Mr Colin Skidmore (Consultant) | AIG | Member |
| Tarcoola Exploration Results (after 15 Nov 2021) | Mr Marc Twining (Employee) | AusIMM | Member |
| Tunkillia Exploration Results (until 15 Nov 2021) | Mr Colin Skidmore (Consultant) | AIG | Member |
| Tunkillia Exploration Results (after 15 Nov 2021) | Mr Marc Twining (Employee) | AusIMM | Member |
| Tunkillia Mineral Resource | Dr Andrew Fowler (Consultant) | AusIMM | Member |
| Challenger Mineral Resource | Mr Dale Sims (Consultant) | AusIMM / AIG | Fellow / Member |
| Western Gawler Craton JV Mineral Resource | Mr Richard Maddocks (Consultant) | AusIMM | Fellow |
The information relating to historic Exploration Results and Mineral Resources in this announcement is extracted from the Company's Prospectus dated 14 May 2021 or as otherwise noted in this announcement, available from the Company's website at www.bartongold.com.au or on the ASX website www.asx.com.au. The Company confirms that it is not aware of any new information or data that materially affects the Exploration Results and Mineral Resource information included in previous announcements and, in the case of estimates of Mineral Resources, that all material assumptions and technical parameters underpinning the estimates in the Prospectus continue to apply and have not materially changed. The Company confirms that the form and context in which the applicable Competent Persons' findings are presented have not been materially modified from the previous announcements.
Cautionary Statement Regarding Forward-Looking Information
This document may contain forward-looking statements. Forward-looking statements are often, but not always, identified by the use of words such as "seek", "anticipate", "believe", "plan", "expect", "target" and "intend" and statements than an event or result "may", "will", "should", "would", "could", or "might" occur or be achieved and other similar expressions. Forward-looking information is subject to business, legal and economic risks and uncertainties and other factors that could cause actual results to differ materially from those contained in forward-looking statements. Such factors include, among other things, risks relating to property interests, the global economic climate, commodity prices, sovereign and legal risks, and environmental risks. Forward-looking statements are based upon estimates and opinions at the date the statements are made. Barton undertakes no obligation to update these forward-looking statements for events or circumstances that occur subsequent to such dates or to update or keep current any of the information contained herein. Any estimates or projections as to events that may occur in the future (including projections of revenue, expense, net income and performance) are based upon the best judgment of Barton from information available as of the date of this document. There is no guarantee that any of these estimates or projections will be achieved. Actual results will vary from the projections and such variations may be material. Nothing contained herein is, or shall be relied upon as, a promise or representation as to the past or future. Any reliance placed by the reader on this document, or on any forward-looking statement contained in or referred to in this document will be solely at the readers own risk, and readers are cautioned not to place undue reliance on forward-looking statements due to the inherent uncertainty thereof.
* Refer to Barton Prospectus dated 14 May 2021 and ASX announcement dated 11 December 2023. Total Barton attributable JORC (2012) Mineral Resources include 798koz Au (25.8Mt @ 1.0 g/t) in Indicated and 661koz Au (21.3Mt @ 1.0 g/t) in Inferred categories.
JORC Table 1 - Tunkillia Gold Project
Section 1 Sampling Techniques and Data
Criteria | Commentary |
Sampling techniques Nature and quality of sampling (e.g. cut channels, random chips, or specific specialised industry standard measurement tools appropriate to the minerals under investigation, such as down hole gamma sondes, or handheld XRF instruments, etc.). These examples should not be taken as limiting the broad meaning of sampling. Include reference to measures taken to ensure sample representivity and the appropriate calibration of any measurement tools or systems used. Aspects of the determination of mineralisation that are Material to the Public Report. In cases where ‘industry standard' work has been done this would be relatively simple (e.g. "RC drilling was used to obtain 1 m samples from which 3 kg was pulverised to produce a 30 g charge for fire assay"). In other cases, more explanation may be required, such as where there is coarse gold that has inherent sampling problems. Unusual commodities or mineralisation types (e.g. submarine nodules) may warrant disclosure of detailed information | Sampling during Barton Gold's RC drill programs at Tunkillia was obtained through reverse circulation (RC) and diamond drilling methods Historic RC and diamond drilling methods were also used in drilling campaigns completed since the mid-1990s. Rotary air-blast (RAB) and aircore drilling has also been completed. These holes were used to guide interpretation but were not used modelling or grade estimations of the results reported in the accompanying Announcement. The drilling program used a Metzke cone splitter (or similar) attached to the cyclone. One-metre splits were constrained by chute and butterfly valves to derive a 2-4kg split on the cyclone. Samples above 1m depth were not collected. Diamond core for drilling has been sawn in half using an automated core saw. Field duplicates were derived from using quarter core for the designated interval. Historic diamond core has been sawn in half or quarter using a core saw. The sample preparation for drilling conducted in 2022 and 2023 of the one-metre sampling for Barton Gold's RC and diamond drill program was conducted by Bureau Veritas (Adelaide) using method FA1 where the 2-3kg split sample received at the laboratory is weighed, dried, crushed to 10mm, pulverized to 75 micron and split to provide a 40g sample for fire assay analysis. The sample preparation of the one-metre sampling for Barton Gold's 2021 RC drill program was conducted by Intertek Genalysis (Adelaide) using method SP1 where the 2-3kg split sample received at the laboratory is weighed, dried, crushed to 3mm, pulverized to 75 micron and split to provide a 50g sample for fire assay and adequate pulverized material for multi-element analysis. For early RC drillholes (1996-1997), the 1 metre samples were collected through a cyclone and collected in poly bags. Samples were initially taken as 4 metre spear composites and then re-assayed at 1 metre intervals if the initial sample returned a grade above a certain threshold. RC drillholes drilled post-1997 were sampled through an on-rig splitter system The majority of core samples were taken as 1 metre lengths and half-cored. |
Drilling techniques Drill type (e.g. core, RC, open-hole hammer, rotary air blast, auger, Bangka, sonic, etc.) and details (e.g. core diameter, triple or standard tube, depth of diamond tails, face-sampling bit or other type, whether core is oriented and if so, by what method, etc.). | The RC drilling by Barton Gold used a face-sampling 5 ¾" RC drilling techniques undertaken by Bullion Drilling using a Schramm T685WS drilling rig with auxiliary compressor. The diamond drilling program used a UDR1200 drill rig provided by Resolution Drilling, drilling NQ2 (50.7mm diameter) size drill core, using a standard tube configuration. Diamond drill holes were precollared with RC drilling. Drill core was oriented (bottom of hole) using the Axis Champ orientation system. Historically slimline RC drilling used a face-sampling hammer bit with a diameter of ~90mm. All other RC drillholes were drilled using a "standard size" hammer (ranging from 120mm-136mm). Diamond drillholes have been pre-drilled to fresh rock using a RC pre-collar or cored from surface, with a range of diameters used: NQ, PQ, HQ. |
Drill sample recovery Method of recording and assessing core and chip sample recoveries and results assessed. Measures taken to maximise sample recovery and ensure representative nature of the samples. Whether a relationship exists between sample recovery and grade and whether sample bias may have occurred due to preferential loss/gain of fine/coarse material. | During drilling programs drilling recoveries were qualitatively described for each drilled interval in the field database along with an estimation of moisture content. In general recoveries were good, in the order of 30-40kg for each one-metre interval. Water was encountered in some drill holes and wet samples were collected from some intervals, although wet samples comprise <3% of sampling overall. No reduced sample weights were recorded with wet intervals and a review of results does not indicate contamination between adjacent samples. Samples submitted to the laboratory were weighed on a dry, as-received basis and reported along with assay results. Recoveries for diamond drill core were measured and recorded. No quantitative recoveries were recorded from pre 2021 RC drilling. However, consistent sample weights were noted within mineralised zones in previous reports. No quantitative recoveries have been recorded from previous diamond drilling through mineralised zones. However, previous MRE and geological reports indicate there has been negligible loss through mineralised zones. Recoveries of 90-100% were achieved in geotechnical drilling of the saprolite for geotechnical assessment. The RC and diamond drilling was closely monitored by the site geologist to ensure optimal recovery and that samples were considered representative. Historically, HQ triple tube (HQ3) drilling was used for some holes to maximise core recovery. Re-entry holes were not triple-tubed as they were drilled straight into fresh bedrock. Drilling rates were controlled, and short drill runs were often used through the oxide zone to maximise core recovery. No relationship between grade and recovery has been identified. |
Logging Whether core and chip samples have been geologically and geotechnically logged to a level of detail to support appropriate Mineral Resource estimation, mining studies and metallurgical studies. Whether logging is qualitative or quantitative in nature. Core (or costean, channel, etc.) photography. The total length and percentage of the relevant intersections logged. | All drilling programs electronically logged a number of parameters direct into a database including: Stratigraphy, lithology, weathering, primary and secondary colour, texture, grainsize, alteration type-style-intensity and mineralisation type-style-percentage. Historically RC chips and diamond core were logged by experienced geologists as a hard copy or into a DataShed database. From 2023 Barton has stored all drilling data in an in-house managed MS Access database. All diamond core was photographed. Structural measurements were made on core oriented using either a spear and Ezy-Mark (pre-Barton) or Reflex (Barton) core orientation devices. Core is stored on site and at the South Australian Government's Adelaide Core Library. All diamond core and RC drilling has been geologically logged. |
Subsampling techniques and sample preparation If core, whether cut or sawn and whether quarter, half or all core taken If non-core, whether riffled, tube sampled, rotary split, etc. and whether sampled wet or dry. For all sample types, the nature, quality and appropriateness of the sample preparation technique. Quality control procedures adopted for all subsampling stages to maximise representivity of samples. Measures taken to ensure that the sampling is representative of the in-situ material collected, including for instance results for field duplicate/second-half sampling. Whether sample sizes are appropriate to the grain size of the material being sampled. | Diamond drill core was sawn in half with one half taken for sampling. Sample lengths were generally 1m although at times were sampled to geological intervals. Selected intervals of whole core were used for geotechnical test work. Selected intervals of sawn half and quarter core and RC chip samples were used for metallurgical test work. Selected intervals of sawn half and quarter core and RC chip samples were used for metallurgical test work. No information is available as to whether the RC chip samples used for metallurgical test work was riffle split or tube sampled. The RC drilling program used a Metzke cone splitter mounted on the cyclone with one-metre splits constrained by chute and butterfly valves to derive a 2-4kg split on the cyclone. The majority (>97%) of samples were dry and when samples were wet they were recorded in the sampling records. The majority of the historical RC samples have been collected at 1 metre intervals using a rifle splitter attached to the drill rig. Periodically between 1996 and 2011, within the strongly weathered portion, samples were collected over 4m intervals. The sample was speared to achieve a representative portion from the interval. For AC drilling, a 1 m sampling interval was applied from surface. All dry samples were caught in a bucket beneath the cyclone and then split through a two-tier riffle splitter to produce a sample of about 2-3 kg. Wet samples were caught in green sample retention bags and then spear sampled, although there were very few wet samples as the drilling depths are too shallow to encounter large volumes of water. Subsampling is performed during the preparation stage according to the assay laboratories' internal protocols. During the RC drilling program a field duplicate was collected off a second chute on the cyclone splitter at a frequency of either 1 for each 16-original sample intervals (2021 drilling), 1 for each 22-orignal sample intervals (2022 drilling) or 1 for each 50-original sample intervals (2023 drilling). Field duplicates for diamond core were obtained by submitting quarter core for the selected intervals (ie half core was retained for all field duplicate intervals) Early drillholes up until 2006 utilised field duplicates and blanks as their only QAQC, this effectively accounts for 57% of the holes used in the current resource estimation. Sample sizes are considered to be appropriate to the grain size of the material being sampled. |
Quality of assay data and laboratory tests The nature, quality and appropriateness of the assaying and laboratory procedures used and whether the technique is considered partial or total. For geophysical tools, spectrometers, handheld XRF instruments, etc., the parameters used in determining the analysis including instrument make and model, reading times, calibrations factors applied and their derivation, etc. Nature of quality control procedures adopted (e.g. standards, blanks, duplicates, external laboratory checks) and whether acceptable levels of accuracy (i.e. lack of bias) and precision have been established. | Barton Gold (2022) - 2-4kg splits were sent to Bureau Veritas in Adelaide for preparation and analysis using 40g fire assay techniques for gold. . Bureau Veritas' FA1 method uses a 40g lead collection fire assay with AAS finish to a 0.01 ppm detection limit. Barton Gold (2021) - 2-4kg splits were sent to Intertek Genalysis in Adelaide for preparation and analysis using 50g fire assay techniques for gold and ICPOES/MS for multielement geochemistry. Whilst preparation and some fire assays were undertaken in Adelaide Intertek also sent some batches to their Perth laboratories for analysis. Intertek's FA50/OE04 method uses a 50 g lead collection fire assay with ICP-OES / MS finish to a 0.005 ppm detection limit. Multielement samples were analysed using Intertek's method 4A/MS48 which is a 4-acid digest followed by analysis using ICP-OES and MS for 48 elements. Pre-2003 samples were sent to Analabs for analysis. Post 2003 samples were sent to Intertek Genalysis Laboratory for assay Gold values were determined by aqua regia digest (B/ETA or B/SAAS) and any values returning >1ppm were repeated using fire assay (FA25/AAS). If a fire assay was taken then this became the "official" assay. All other elements were determined using multi-acid digest (AT/OES) Analytical techniques have varied somewhat over the projects history. No geophysical studies were used in the course of Barton Gold drilling programs. Barton Gold's RC and diamond drilling programs included a comprehensive QAQC component with Field Duplicate samples taken at every 16th (2021 drilling), 25th sample (2022 drilling) or 50th sample (2023 drilling); Certified Standards (selection of OREAS CRM's considered most appropriate for expected grade and composition) were inserted randomly in sequence for at every 20th (2021 drilling), 25th (2022 drilling) or 50th sample (2023) submitted; blanks were inserted in sequence at every 50th sample submitted. Additionally, the laboratories provided their internal QAQC which included check samples, CRM's, blanks and repeats. Analysis of the duplicate samples was reasonable given the majority fell below detection. There was no evidence of cross-contamination in the submitted blank samples. Both Intertek and Bureau Veritas' analysis for gold using fire assay performed well with all batches falling within the +/-3SD test of the expected value for the given standards (3 OREAS CRM's). Historically, the amount of sampling and analytical QC data that has been collected has varied over the project's history. Early drillholes up until 2006 utilised field duplicates and blanks as their only QAQC, this effectively accounts for 57% of the holes used in the estimation. Post 2006, QAQC samples were submitted in the form of field duplicates and Certified Reference Standards from Ore Research & Exploration Pty Ltd. Standards were submitted every 20th sample and field duplicates every 50th sample. No material concerns were highlighted in the analysis of QAQC data. Tunkillia Gold used blanks to monitor carry-over contamination and no significant issues were detected. Field duplicates were used to assess sample precision, while CRMs were used to assess analytical accuracy. Some pulps were also sent to an umpire laboratory as a further check on analytical accuracy. Field duplicate results provide a guide to sample precision. The expected scatter (due to high nugget effect) is monitored and is expected to remain within a range. The CRMs reasonably demonstrated the accuracy of the laboratory. Pulp repeats demonstrated acceptable performance. |
Verification of sampling and assaying The verification of significant intersections by either independent or alternative company personnel. The use of twinned holes. Documentation of primary data, data entry procedures, data verification, data storage (physical and electronic) protocols. Discuss any adjustment to assay data. | Alternative company personnel have verified significant intersections. No twinned holes were undertaken on the 2022 program reported in this release. A number of historic RC holes have been twinned by diamond holes, confirming the position of the mineralised envelopes and grade characteristics in the system. |
Location of data points Accuracy and quality of surveys used to locate drillholes (collar and downhole surveys), trenches, mine workings and other locations used in Mineral Resource estimation. Specification of the grid system used. Quality and adequacy of topographic control. | All data collected in the reported program including collar details, drilling records, sampling records and geological logs are recorded directly into spreadsheets in the field which includes comprehensive interval validation processes. Gyro downhole surveys and Assay results were provided in digital format. All relevant historical data was entered into a DataShed database where various validation checks were performed. Data was exported into an Access Database. No adjustments were made to any assay data in this release. All 2023 RC and diamond drill collars were sited using a Garmin hand-held GPS system. The RL was generated from the LiDAR survey collected at the completion of drilling. All Barton RC holes were downhole surveyed using a Reflex EZ-Gyro system which provided measurements at 10m intervals up and down hole. All Barton diamond holes were surveyed using a single-shot gyro tool at 15m intervals during drilling operations. 488 out of a total of 556 drillhole collars from drilling prior to 2021 were located using DGPS survey techniques. The raw data for 30% of these have been located and verified. Earlier collars were located by measuring off a local grid system. 384 drillholes were surveyed using a down-hole survey instrument. 50 holes were surveyed in the rod and therefore do not have azimuth data. The remaining holes do not have downhole surveys. No AC holes were surveyed. All site data is reported in Geocentric Datum of Australia 1994 (GDA94) and Vertical Datum in Australian Height Datum (AHD). The map projection is MGA Zone 53. Historic Survey Data has been converted to GDA94. Historically the Tunkillia Project uses the Remington local grid which is rotated 31.37 degrees west of the MGA 94 grid with a local origin of 110,000E and 111,500N Transformation Formula: Local E = 110000 + ((MGA94_E - 477614.802 ) cos a) + ((MGA94_N - 6545289.018) sin a)) Local N = 111500 + ((MGA94_N - 6545289.018) cos a) - (MGA94_E - 477614.802) sin a)) Where angle a = 31.37 Local RL = mRL_MGA+1009.232 In September 2021 Barton engaged Aerometrex to collect LiDAR and high-resolution ortho-imagery over the entire Tunkillia project area. All datasets are levelled to the LiDAR survey |
Data spacing and distribution Data spacing for reporting of Exploration Results. Whether the data spacing and distribution is sufficient to establish the degree of geological and grade continuity appropriate for the Mineral Resource and Ore Reserve estimation procedure(s) and classifications applied. Whether sample compositing has been applied. | Barton's RC and diamond drilling program at the 223 deposit was conducted at variable spacing as dictated by existing drilling and the aims of the program to provide continuity with the existing drill coverage. The spacings are considered appropriate for the reporting of exploration results. Historically drilling has been undertaken at various spacings. The drilling incorporated in the resource database extends from local grid co-ordinates 109,930N to 113,870N and 109,430E to 110,390E. Sections are on a 25 metre spacing from 111,250N to 111,850N outside of this drill sections extend to 50m between 110,600N to 112,600N. Drill sections extend to 100m+ for the remainder of Area 223. On section drill spacing generally ranges from 20-30m, increasing to 50 metres with the majority of drilling on section and perpendicular to strike. The resource has been drilled to a maximum depth of 360 metres below surface and is not closed off down dip. Metallurgical testwork has been conducted on cored samples. Details of sample composites used in the resource estimate are set out in Section 3 of this table. |
Orientation of data in relation to geological structure Whether the orientation of sampling achieves unbiased sampling of possible structures and the extent to which this is known, considering the deposit type. If the relationship between the drilling orientation and the orientation of key mineralised structures is considered to have introduced a sampling bias, this should be assessed and reported if material. | Barton's RC and diamond drill program was orientated to optimally test predicted mineralised structures and stratigraphic positions to provide were possible unbiased samples. Historic holes have been drilled at several orientations, and the orientation of relevant mineralisation-hosting geological structures varies considerably. Drill sections are orientated local grid E-W, perpendicular to the main mineralised lenses. The majority of drillholes used to define the steeply west dipping primary mineralisation are drilled towards the east at -60 degrees. Drillholes targeting the oxide resource have been drilled vertically. Some of the initial exploration drillholes have been drilled oblique to the strike of mineralisation. The relationship between the drilling orientation and the orientation of key mineralised structures is not considered to have introduced a sampling bias. |
Sample security The measures taken to ensure sample security. | Barton Gold staff oversaw the sampling on the RC drill rig and maintained oversight of sample security whilst onsite during the drilling programs. Split samples were inserted into pre-printed calico bags. These tied bags were, in batches of 5, ziplocked into labelled poly-weave bags which were inserted into ziplocked Bulka-bags. The bulka bags were strapped onto pallets and loaded by a Barton Gold representative on to a semitrailer for transport to the laboratories in Adelaide and Perth. The trailers were not unloaded whilst in transit. Diamond drill core was transported from the project site to Adelaide and cut by experienced and reputable service providers. The core cutting agents undertook sampling of the drill core and subsequent delivery of samples to the laboratory. Barton Gold staff undertook regular visits during core cutting and sampling processes to verify the integrity of processes being undertaken. Barton does not have detailed information in regard to sample security measures taken by previous owners of the Tunkillia project. However, Barton understands that these procedures have been in accordance with commonly adopted standard industry practices. |
Audits or reviews The results of any audits or reviews of sampling techniques and data | An internal peer review of the exploration data processes has been completed by Barton Gold which has included a detailed review of the assay, survey and QAQC data. |
Section 2 Reporting of Exploration Results
Criteria | Commentary |
|---|---|
Mineral tenement and land tenure status Type, reference name/number, location and ownership including agreements or material issues with third parties such as joint ventures, partnerships, overriding royalties, native title interests, historical sites, wilderness or national park and environmental settings. The security of the tenure held at the time of reporting along with any known impediments to obtaining a licence to operate in the area. | The Tunkillia Project area is located 530 km north-west of Adelaide in South Australia's Gawler Craton. It is 100% owned by Tunkillia 2 Pty Ltd which is a wholly owned subsidiary of Barton Gold Holdings Limited. The project comprises two exploration licences that were grouped into an Amalgamated Expenditure Agreement on 4th October 2012 and Joint Venture Reporting on 21st January 2013. Most of the South Australian tenements held by WPG Resources were bought by current owner Barton Gold Pty Ltd on 1st November 2019. The three current tenements comprise EL6845, EL6639 and EL5901 which have a combined area of 1,362 km2. The Tunkillia Project was under three overlapping Native Title claims which are now grouped into a single organisation, the Gawler Ranges Aboriginal Corporation (GRAC) that represents all three groups. Barton Gold's negotiations with GRAC secured a signed Native Title Mining Agreement for Exploration for EL's 6845, EL6639 and EL5901 on 2nd February 2021. Barton's Exploration Licences 6845, 6639 and 5901 are subject to South Australian State royalties and entitled to a reduced ‘new mine' State royalty rate of 2% of the value of minerals recovered until 30 June 2026, and are also subject to total 2.5% private royalties (gross product). There are no joint ventures over the Tunkillia Project tenure. There are no known impediments to obtaining future licences. |
Exploration done by other parties Acknowledgment and appraisal of exploration by other parties. | Exploration in the Tunkillia area commenced in 1996 with a regional geochemical survey by Helix Resources who established the local Remington grid. Infill sampling delineated the Tunkillia Prospect as a 20 km2 geochemical gold in calcrete anomaly. Subsequent RAB drilling led to the discovery of the Area 223 deposit in late 1996. RC drilling in early 1997 further enhanced the discovery. A joint venture was formed with Acacia who took over management of the project with subsequent exploration carried out as the Gawler Craton Joint Venture. The JV later involved AngloGold Australasia Ltd following its takeover of Acacia. In June 2003, Helix finalised the acquisition of AngloGold's 49% interest and returned 100% of the project to Helix An independent resource assessment by Snowden Mining Industry Consultants prompted an extensive 12,000m RC program to infill the Area 223 resource. A re-interpretation of the aeromagnetic data identified new exploration targets away from the known resource outlining mineralisation at Tomahawk and Areas 191. In April-June 2004 Helix completed an 8000 m RC drilling program testing areas of the Area 223 North and South mineralisation and exploration concepts at Area 191 and the central part of the shear zone. Studies were completed by Resource Evaluations Pty Ltd in June 2004 looking at resource estimates and optimisation studies based on the available drilling. A Joint Venture commenced between Helix and Minotaur Exploration Ltd in April 2005 where Minotaur assumed operation and management of the project. Minotaur undertook an intense exploration effort in the immediate surrounds of the Area 223 resource, and regionally. In 2007, Minotaur re-appraised the Area 223 resource using recent drilling and separated distinct oxide and sulphide domains. In January 2012, Mungana acquired the 55% interest in the Tunkillia Gold Project via the acquisition of Minotaur's wholly owned subsidiary Minotaur Ventures Pty Ltd. WPG Resources acquired 70% of the project in May 2014 through the acquisition of the Tarcoola and Tunkillia projects from Mungana Goldmines Ltd. In Nov 2014 WPG moved to 100% ownership of the Tunkillia gold project by acquiring the 30% owned by Helix Resources. WPG Resources completed work on calcrete samples over a number of targets along the Tunkillia "Line of Lode". Drilling of selected Area 51 and Tomahawk Extended areas included ten RC holes for 1,641m. No further work was undertaken by WPG Resources until the project was purchased by Barton Gold in late 2019. |
Geology Deposit type, geological setting and style of mineralisation. | The Tunkillia Project extends over a large portion of the Central Gawler Craton of South Australia which is bound to the east by the Gawler Range Volcanic Province. The central portion of the Gawler Craton consists of a variety of geological units and is structurally complex. Archaean metamorphic rocks and greenstone-belt units are distributed along WSW-ENE trends. During the Palaeoproterozoic, granitoids including the Tunkillia Suite were emplaced possibly with associated deformation. During these deformation episodes, major shear zones developed, including the east-trending Yerda and Oolabinnia Shear Zones and north-trending Yarlbrinda Shear Zone. The Yarlbrinda Shear Zone and Yerda Shear Zone are up to several kilometres wide with ductile shearing and deformation probably occurring before ~1600 Ma and before Mesoproterozoic anorogenic magmatism. During the Mesoproterozoic, widespread anorogenic magmatism across the central portion of the craton resulted the Gawler Range Volcanics, Hiltaba Suite granite (1595-1575 Ma) and emplacement of minor gabbroic plugs. Development of Cu-Au +/- U mineralisation at Olympic Dam and Prominent Hill and gold dominant mineralisation at Tunkillia and Tarcoola occurred during this period. Typical lithologies encountered in the Area 223 deposit from west to east include variably sheared chlorite-biotite-rich augen gneiss (Tunkillia Augen Gneiss) grading into a highly chloritised and mylonitised phyllonitic shear. The phyllonitic shear zone grades into a weakly gneissic unit to the east which is variably altered by sericite to form the central alteration zone. This unit has a sheared contact with the footwall granite. The host rocks have been intruded by at least two later episodes of dyke emplacement. The mafic dyke appears to form the footwall to the main mineralisation at Area 223. Clear relationships between dyke emplacement and the mineralisation remain unclear. The dykes appear to cross-cut mineralisation at Area 223 and are unmineralised in fresh rock. But in the weathered zone gold occurs within the weathered dyke and also to east of this apparent ‘bounding' lithology. The main mineralisation appears to occur within en-echelon sets of quartz-sulphide tension veins predominately bounded by duplex shears, with brittle fractures extending into the hanging wall. The mineralised sequence at Area 223 has undergone extensive weathering which formed a leached kaolinitic profile capped by a silcrete layer. No palaeochannels are observed at Area 223 although they do occur elsewhere in the Tunkillia area. At 50-60 metres depth near the base of the weathering profile a zone of supergene mineralisation is developed which shows some enrichment compared with the underlying primary lodes. Gold appears to have been laterally dispersed over a distance of tens of metres within the oxide zone. |
Drillhole information A summary of all information material to the understanding of the exploration results including a tabulation of the following information for all Material drillholes:
If the exclusion of this information is justified on the basis that the information is not Material and this exclusion does not detract from the understanding of the report, the Competent Person should clearly explain why this is the case. | A tabulation of the drilling program including the details of historic holes mentioned in this announcement are presented in Tables 2 - 5. |
Data aggregation methods In reporting Exploration Results, weighting averaging techniques, maximum and/or minimum grade truncations (e.g. cutting of high grades) and cut-off grades are usually Material and should be stated. Where aggregate intercepts incorporate short lengths of high grade results and longer lengths of low grade results, the procedure used for such aggregation should be stated and some typical examples of such aggregations should be shown in detail. The assumptions used for any reporting of metal equivalent values should be clearly stated. | Reported intersections used the following criteria:
|
Relationship between mineralisation widths and intercept lengths These relationships are particularly important in the reporting of Exploration Results. If the geometry of the mineralisation with respect to the drillhole angle is known, its nature should be reported. If it is not known and only the down hole lengths are reported, there should be a clear statement to this effect (e.g. "downhole length, true width not known"). | Drillholes have been designed to intersect the mineralisation zone as perpendicular as possible. Reported intercepts are downhole length and true width can generally be estimated because the dip of the mineralisation is known. |
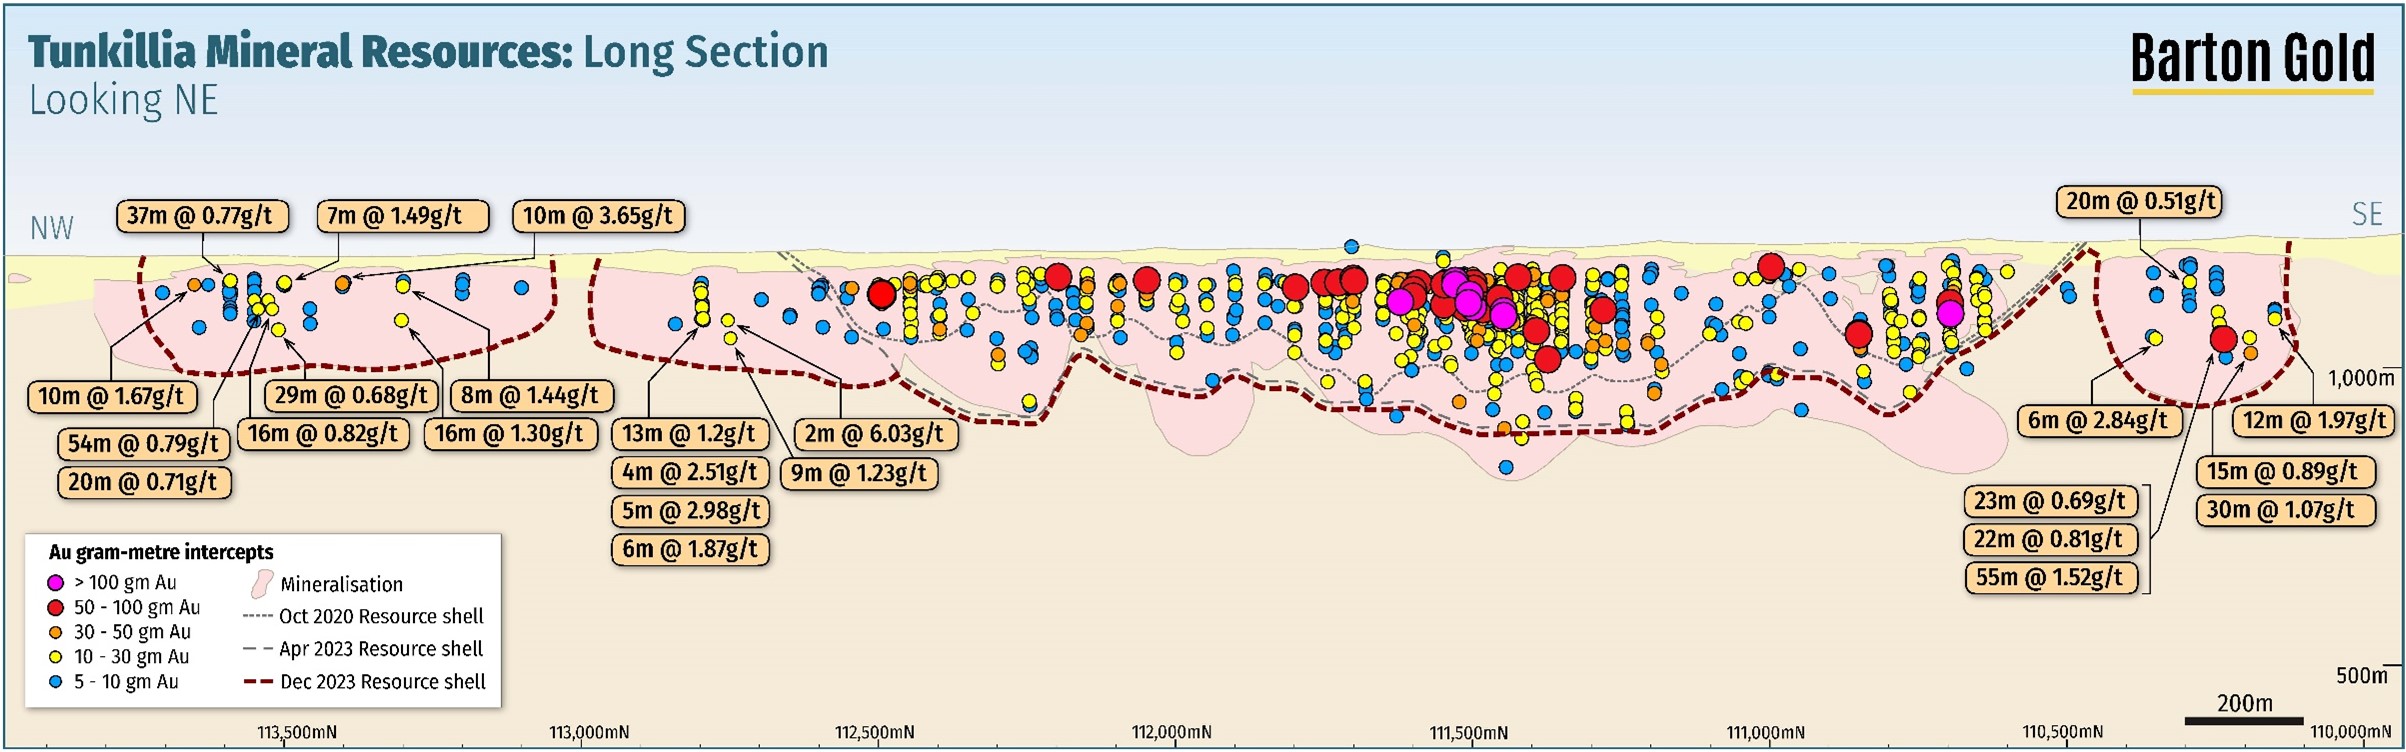
Diagrams Appropriate maps and sections (with scales) and tabulations of intercepts should be included for any significant discovery being reported These should include, but not be limited to a plan view of drillhole collar locations and appropriate sectional views. | See Figures included the body of this Announcement. Relevant commentary relating to diagrams is discussed under the heading of Balanced Reporting. |
Balanced reporting Where comprehensive reporting of all Exploration Results is not practicable, representative reporting of both low and high grades and/or widths should be practiced to avoid misleading reporting of Exploration Results. | Balanced reporting of Exploration Results is presented |
Other substantive exploration data Other exploration data, if meaningful and material, should be reported including (but not limited to): geological observations; geophysical survey results; geochemical survey results; bulk samples - size and method of treatment; metallurgical test results; bulk density, groundwater, geotechnical and rock characteristics; potential deleterious or contaminating substances. | Extensive geological, geophysical, geochemical, geotechnical and metallurgical datasets are available for the Tunkillia project area. Other datasets including gravity that was sourced from open-file datasets (SA DEM). Historical data acquired by previous owners included detailed aeromagnetic, TEMPEST airborne EM and in-fill gravity surveys completed over parts of the tenement area and mostly focussed on the Yarlbrinda Shear Zone. Other data includes gradient array IP, biogeochemical sampling, CHIM/MMI geochemical sampling and spectral scanning of reverse circulation drill chips. |
Further work The nature and scale of planned further work (e.g. tests for lateral extensions or depth extensions or large-scale step-out drilling). Diagrams clearly highlighting the areas of possible extensions, including the main geological interpretations and future drilling areas, provided this information is not commercially sensitive. | The mineralisation at Tunkillia remains open along strike and downdip with potential for additional gold mineralisation at the Area 223 deposit and in other parallel structures in the area including Area 51, Tomahawk and Area 191. Barton Gold is planning further drilling work which will be focused on testing for dip and strike extensions and to confirm grade and geological continuity within the current model. While geophysical coverage already exists, additional geophysical exploration techniques may be undertaken as the project continues and may include magnetic surveys and ground-based gravity. Diagrams have been included in the body of this Announcement. |
Section 3 Estimation and Reporting of Mineral Resources
Criteria | Commentary |
|---|---|
Database integrity Measures taken to ensure that data has not been corrupted by, for example, transcription or keying errors, between its initial collection and its use for Mineral Resource estimation purposes. Data validation procedures used. | Mining Associates (MA) has undertaken limited independent first principal checks using hard copies of results and sectional interpretations. Historical Independent Technical Reports accept the integrity of the database. The geological database has been managed by several different database management providers over the years. The database is currently managed by the Barton Gold using MS Access. Preceding historic data was obtained from open file reports. Basic database validation checks were run, including collar locations, drill holes plot on topography, checks for missing intervals, overlapping intervals and hole depth mismatches. |
Site visits Comment on any site visits undertaken by the Competent Person and the outcome of those visits. If no site visits have been undertaken indicate why this is the case. | The Competent Person (CP, Mr I.Taylor) visited site from the 1st to 4th November 2022 during the 2022 drill program to review the geology, drill core, field and drill practices as part of the 2023 Mineral Resource Estimate Update. Selected drill holes were laid out and reviewed by the CP. Data collection and discussions with the site geologists were the primary focus of the visits, a greater understanding of the geological setting and appreciation of Barton's Gold Procedures. |
Geological interpretation Confidence in (or conversely, the uncertainty of) the geological interpretation of the mineral deposit. Nature of the data used and of any assumptions made. The effect, if any, of alternative interpretations on Mineral Resource estimation. The use of geology in guiding and controlling Mineral Resource estimation. The factors affecting continuity both of grade and geology. | Confidence in the geological interpretation is considered moderate to high, dependent on the differing drill hole spacing in parts of the deposit. Interpretations are based solely on drill hole data: there is no outcrop in the area covering the deposit. 90% of drill metres are RC, which limits the available information on structures. Diamond holes are strategically placed for maximum structural understanding. Drill core and RC chip logging has been used to define the main geological units and weathering profile boundaries. Observations from diamond drill core indicate that mineralized veins generally overprint (but can also be concordant to) a pervasive shear foliation present in granitic host rocks. Alternative interpretations of mineralized domain boundaries would affect tonnage and grade, although the CP is confident that the current model is the best representation of the deposit based on available data. Fourteen fresh rock mineralized structures were interpreted, based on continuity of grade at a lower cut-off of 0.25 g/t Au at the Tunkillia 223 deposit. One small high-grade domain was defined based on a lower cut-off of 2.0 g/t Au. Three structures were interpreted at Southern 223, and five structures were interpreted at a lower cut off of 0.25 g/t at Area 223 North. Structures were grouped into geostatistical domains based on grade similarities and structural orientation. Tunkillia (223) and Southern 223 strike grid (local) north-south and dip steeply west. Two post-mineralisation mafic dykes and one dacite dyke were modelled and the resulting volumes were assigned zero grade. Area 223 North strikes grid NNW (local) and dip moderately to WSW. Minor cross faulting does exist at the project, the offsets are considered too small to be significant at a resource scale Additional work is required to determine the nature of the structural controls on mineralised domain boundaries.. |
Dimensions The extent and variability of the Mineral Resource expressed as length (along strike or otherwise), plan width, and depth below surface to the upper and lower limits of the Mineral Resource. | The Tunkillia 223 Deposit is defined with approximately 2.4 km strike and is comprised of multiple domains ranging between five and twenty metres wide. In the central zone of the 223 Deposit where the domains converge (and where the high-grade has been defined) the aggregate mineralised width of the 223 Deposit ranges from eighty to one hundred metres width. The depth of the deposit had been defined beyond 300 m below the surface. The reported resource has been reported to 300 m below the surface. Mineralisation strikes NW (UTM) and dips steeply to the SW ~70°. The shear structure and contained HG shoots are expected to propagate to depth and are open down plunge. The Southern 223 zone is defined with approximately 340m strike length and is between 5 and 20 metres wide. The Area 223 North zone strikes (local grid) NNW and has a strike length of approximately 780m, dipping moderately to the WSW |
Estimation and modelling techniques In the case of block model interpolation, the block size in relation to the average sample spacing and the search employed. Any assumptions behind modelling of selective mining units. Any assumptions about correlation between variables. Description of how the geological interpretation was used to control the resource estimates. Discussion of basis for using or not using grade cutting or capping. The process of validation, the checking process used, the comparison of model data to drill hole data, and use of reconciliation data if available. | The deposit is drilled on 50 m sections with drill centres commonly spaced 25 m sections resulting in down dip pierce points are commonly 25 m. A KNA analysis showed the optimal block size was 10 x 25 x 10 m. MA chose a smaller parent block size of 10 x 20 x 5 m to add detail in the commonly tighter 25 x 25 m drilled areas and the likely finial mining scenario, (open pit benches). The sub blocking was chosen to reflect a likely SMU of and open pit operation, (1.25 x 2.5 x 1.25 m (XYZ)) Search ellipses were based on variogram ranges and were optimised to 80 m in the long axis. A two pass estimation process was employed, the first pass (80m) required a minimum of 12 samples and a maximum of 20 composites, the second pass (160m) required a minimum of 6 composites and a maximum of 16 composites. The deposit is best suited to open pit mining methods, the sub block size chosen (1.25, 3.25, 1.25m (XYZ) was chosen to reflect a reasonable smallest mining unit assuming 5 m blasts and 2.5 flitches. The smallest mining unit also was considered when selecting appropriate composite lengths. Gold and silver mineralisation are well correlated. However silver mineralisation is too low a grade to be economically significant. The geological model included weathering profiles, and post mineralisation dykes. Mineralisation above the base of weathering is assumed to be affected by supergene or weathering effects and is interpreted as dominantly horizontal lenses. The base of weathering is considered a hard boundary during interpretation. No grade is interpreted into the post mineralisation dykes. 2 m composite assays were reviewed, extreme outliers were checked against primary assay results and in relation to the remainder of the domain. Global drill hole and sample means were compared. Localised Swath plots were checked, both at the deposit scale and domains scale. Grade tonnage curves from a Nearest neighbour and ID2 estimate were compared to the OK grade tonnage curve. No mining has occurred at the project. |
Moisture Whether the tonnages are estimated on a dry basis or with natural moisture, and the method of determination of the moisture. | Tonnages are based on dry tonnes. Dry bulk density has been assigned to the host rock. |
Cut-off parameters The basis of the adopted cut-off grade(s) or quality parameters applied. | The resource is reported above a 0.4 g/t Au lower cut-off. Considering likely open pit mining, conventional heap leach or CIL processing and administration costs a head grade of 0.40 g/t is assumed profitable. Key Assumptions: • Open pit mining method • 1.25m minimum mining width (sub block width), • 6.9:1 strip ratio • Mining and Processing cost of AUD$33.24/tonne for mineralised material. • Gold price AUD 3,000/oz • 95% Metallurgical recovery • 5.0% Dilution • 6.0% Royalty • This is in line with assumptions used in previous Pre-Feasibility Studies. The metal price used was AUD 3,000/oz. |
Mining factors or assumptions Assumptions made regarding possible mining methods, minimum mining dimensions and internal (or, if applicable, external) mining dilution. It is always necessary as part of the process of determining reasonable prospects for eventual economic extraction to consider potential mining methods, but the assumptions made regarding mining methods and parameters when estimating Mineral Resources may not always be rigorous. Where this is the case, this should be reported with an explanation of the basis of the mining assumptions made. | No mining factors or assumptions have been applied to the resource. MA considers the Tunkillia 223 deposit amenable to open pit mining methods and assumes the likely mining scenario will have 5 m benches and 2.5 m flitches. These assumptions have influenced, composite length, block size and resource cut off parameters. |
Metallurgical factors or assumptions The basis for assumptions or predictions regarding metallurgical amenability. It is always necessary as part of the process of determining reasonable prospects for eventual economic extraction to consider potential metallurgical methods, but the assumptions regarding metallurgical treatment processes and parameters made when reporting Mineral Resources may not always be rigorous. Where this is the case, this should be reported with an explanation of the basis of the metallurgical assumptions made. | No metallurgical factors have been applied to the in-situ grade estimates. Metallurgical Recovery is assumed, and a 95% gold recovery is used in the reasonable prospects of economic extraction analysis, no account of silver recovery is considered. Four campaigns of metallurgical test work have been commissioned over the life of the project (1997,2006, 2009,2013). Gold recovery in fresh (Primary) ranges between 81 and 93% and in oxide between 92 to 97% recovery using different scenarios. The 2009 and 2013 studies showed adding a gravity circuit does not improve recovery. Heap Leach recovery is 76% in oxide material and low 30% in fresh material. |
Environmental factors or assumptions Assumptions made regarding possible waste and process residue disposal options. It is always necessary as part of the process of determining reasonable prospects for eventual economic extraction to consider the potential environmental impacts of the mining and processing operation. While at this stage the determination of potential environmental impacts, particularly for a greenfields project, may not always be well advanced, the status of early consideration of these potential environmental impacts should be reported. Where these aspects have not been considered this should be reported with an explanation of the environmental assumptions made. | The Tunkillia 223 deposit has been the subject of past extensive mineral processing and mine planning studies which have concluded the deposit is amenable to conventional open cut mining and CIP gold processing (carbon-in-pulp) techniques. Environmental baseline mapping has not identified any matters that are likely to preclude the future development of a mining operation that requires the on-site management of wastes and process residues (waste rock and process tailings). The consideration of a conventional open-cut mining and CIP gold processing operation, including associated ancillary activities and stand-alone infrastructure, fits within the scope of the South Australian government's approval frameworks and processes for a project such as the Tunkillia 223 deposit. |
Audits or reviews The results of any audits or reviews of Mineral Resource estimates. | There has been no independent audit of the data or mineral resource. |
Discussion of relative accuracy/confidence Where appropriate a statement of the relative accuracy and confidence level in the Mineral Resource estimate using an approach or procedure deemed appropriate by the Competent Person. For example, the application of statistical or geostatistical procedures to quantify the relative accuracy of the resource within stated confidence limits, or, if such an approach is not deemed appropriate, a qualitative discussion of the factors that could affect the relative accuracy and confidence of the estimate. The statement should specify whether it relates to global or local estimates, and, if local, state the relevant tonnages, which should be relevant to technical and economic evaluation. Documentation should include assumptions made and the procedures used. These statements of relative accuracy and confidence of the estimate should be compared with production data, where available. | No geostatistical confidence limits have been estimated. The relative accuracy and confidence in the Mineral Resource Estimate is reflected in the Resource Categories. The ordinary kriging result, due to the high level of smoothing, should only be regarded as a global estimate, and is suitable as a life of mine planning tool. High grade domains were used to restrict the high grade material. Inferred Mineral Resource has a lower level of confidence than that applying to an Indicated Mineral Resource and must not be converted to an Ore Reserve. Should local estimates be required for detailed mine scheduling techniques such as Uniform conditioning or conditional simulation should be considered, ultimately grade control drilling is required. Comparison with the previous estimates indicates that the changes implemented in the current Mineral Resource Estimate produced results that are in line with expectations. No mining has occurred at the Tunkillia 223 deposit. |
Table 2: Drillhole Collar Details for Barton Gold Tunkillia September - October 2023 RC & DD Drilling Program mentioned in this Announcement
| Hole ID | Easting | Northing | RL | DIP | TAZ | Total Depth (EOH) | Type | Completion | Target |
| TKB0112 | 478155 | 6544150 | 206 | -60 | 58 | 144 | RC | 10/09/2023 | Southern 223 |
| TKB0117 | 478023 | 6544059 | 207 | -50 | 58 | 216 | RC | 15/09/2023 | Southern 223 |
| TKB0115 | 478082 | 6544224 | 205 | -60 | 58 | 204 | RC | 13/09/2023 | Southern 223 |
| TKB0118 | 478055 | 6544153 | 207 | -70 | 58 | 220 | RC | 17/09/2023 | Southern 223 |
| TKB0119 | 478113 | 6544126 | 207 | -62 | 58 | 160 | RC | 17/09/2023 | Southern 223 |
| TKB0179 | 478109 | 6544124 | 208 | -80 | 58 | 210 | RC | 13/10/2023 | Southern 223 |
| TKB0185 | 478083 | 6544003 | 206 | -60 | 58 | 222 | RC | 15/10/2023 | Southern 223 |
| TKB0189 | 477970 | 6544039 | 205 | -50 | 58 | 282 | RC | 22/10/2023 | Southern 223 |
| TKB0190 | 477920 | 6544010 | 205 | -50 | 58 | 300 | RC | 23/10/2023 | Southern 223 |
| TKB0131 | 476270 | 6546988 | 178 | -60 | 58 | 120 | RC | 29/09/2023 | 223 North |
| TKB0138 | 476388 | 6546944 | 179 | -60 | 58 | 78 | RC | 6/10/2023 | 223 North |
| TKB0139 | 476365 | 6546928 | 179 | -60 | 58 | 114 | RC | 6/10/2023 | 223 North |
| TKB0140 | 476339 | 6546913 | 178 | -60 | 58 | 120 | RC | 6/10/2023 | 223 North |
| TKB0141 | 476314 | 6546896 | 177 | -60 | 58 | 150 | RC | 6/10/2023 | 223 North |
| TKB0142 | 476287 | 6546882 | 177 | -60 | 58 | 192 | RC | 7/10/2023 | 223 North |
| TKB0143 | 476258 | 6546863 | 177 | -60 | 58 | 180 | RC | 8/10/2023 | 223 North |
| TKB0144 | 476238 | 6546843 | 176 | -60 | 58 | 168 | RC | 8/10/2023 | 223 North |
| TKB0145 | 476206 | 6546830 | 176 | -60 | 58 | 174 | RC | 9/10/2023 | 223 North |
| TKB0146 | 476184 | 6546817 | 176 | -60 | 58 | 120 | RC | 9/10/2023 | 223 North |
| TKB0160 | 476821 | 6546266 | 185 | -60 | 58 | 156 | RC | 3/10/2023 | Northern 223 |
| TKB0161 | 476796 | 6546251 | 185 | -60 | 58 | 204 | RC | 8/10/2023 | Northern 223 |
Table 3: Significant Intersections for Barton Gold Tunkillia September - October 2023 RC & Diamond Drilling Program Mentioned in this Announcement2
| Hole ID | From | To | Metres1 | Au (g/t) | Comments &/or including |
| TKB0112 | 51 | 54 | 3 | 0.76 | |
| TKB0112 | 111 | 118 | 7 | 0.64 | including 1m @ 1.16g/t Au from 111m & 1m @ 1.46g/t Au from 115m & 1m @ 1.2g/t Au from 117m |
| TKB0115 | 189 | 195 | 6 | 2.84 | including 1m @ 14.1g/t Au from 189m |
| TKB0116 | 107 | 116 | 9 | 1.05 | including 1m @ 3.83g/t Au from 113m |
| TKB0116 | 122 | 127 | 5 | 1.45 | including 1m @ 3.7g/t Au from 122m & 1m @ 2.68g/t Au from 126m |
| TKB0116 | 198 | 199 | 1 | 1.76 | |
| TKB0117 | 151 | 174 | 23 | 0.69 | including 1m @ 1.51g/t Au from 158m |
| TKB0117 | 178 | 181 | 3 | 0.94 | |
| TKB0117 | 194 | 216 | 22 | 0.81 | including 6m @ 1.4g/t Au from 205m |
| TKB0118 | 103 | 123 | 20 | 0.51 | |
| TKB0118 | 165 | 167 | 2 | 1.18 | |
| TKB0119 | 55 | 65 | 10 | 0.78 | including 1m @ 2.16g/t Au from 62m |
| TKB0119 | 92 | 94 | 2 | 0.71 | |
| TKB0119 | 119 | 131 | 12 | 1.31 | including 7m @ 2.01g/t Au from 119m |
| TKB0119 | 137 | 150 | 13 | 1.04 | including 4m @ 2.01g/t Au from 145m |
| TKB0119 | 156 | 158 | 2 | 1.86 | |
| TKB0179 | 54 | 59 | 5 | 1.41 | including 1m @ 2.8g/t Au from 54m |
| TKB0179 | 65 | 70 | 5 | 1.06 | including 1m @ 3.3g/t Au from 68m |
| TKB0179 | 78 | 80 | 2 | 2.71 | including 1m @ 4.08g/t Au from 78m |
| TKB0179 | 127 | 142 | 15 | 0.46 | including 1m @ 1.03g/t Au from 134m |
| TKB0179 | 170 | 171 | 1 | 1.22 | |
| TKB0185 | 144 | 156 | 12 | 1.97 | including 4m @ 4.99g/t Au from 151m & including 1m @ 14.8g/t Au from 152m |
| TKB0189 | 214 | 269 | 55 | 1.52 | including 1m @ 3.84g/t Au from 227m & 1m @ 6.2g/t Au from 231m & 1m @ 4.22g/t Au from 235m |
| TKB0189 | 274 | 275 | 1 | 1.16 | |
| TKB0131 | 52 | 62 | 10 | 1.67 | 2m @ 3.79g/t Au from 54m |
| TKB0138 | 48 | 50 | 2 | 1.29 | 1m @ 1.94g/t Au from 48m |
| TKB0140 | 43 | 57 | 14 | 0.88 | 1m @ 6.9g/t Au from 56m |
| TKB0140 | 103 | 105 | 2 | 0.85 | |
| TKB0141 | 46 | 51 | 5 | 0.7 | 1m @ 1.04g/t Au from 49m |
| TKB0141 | 55 | 60 | 5 | 0.77 | 1m @ 1.06g/t Au from 58m |
| TKB0141 | 135 | 144 | 9 | 0.56 | including 1m @ 1.09g/t Au from 140m & 1m @ 1.09g/t Au from 143m |
| TKB0142 | 42 | 51 | 9 | 0.84 | 3m @ 1.18g/t Au from 46m |
| TKB0142 | 57 | 69 | 12 | 0.44 | 1m @ 1.21g/t Au from 57m |
| TKB0142 | 96 | 115 | 19 | 0.7 | 7m @ 1.09g/t Au from 102m |
| TKB0142 | 145 | 159 | 14 | 0.42 | 1m @ 1.13g/t Au from 146m |
| TKB0142 | 164 | 177 | 13 | 0.4 | |
| TKB0143 | 44 | 57 | 13 | 0.47 | |
| TKB0143 | 60 | 114 | 54 | 0.79 | 7m @ 1.3g/t Au from 90m & 1m @ 6.4g/t Au from 105m |
| TKB0143 | 118 | 138 | 20 | 0.71 | 2m @ 2.14g/t Au from 121m & 1m 1.84g/t Au from 136m |
| TKB0143 | 144 | 163 | 19 | 0.59 | 2m @ 1.6g/t Au from 155m |
| TKB0143 | 175 | 180 | 5 | 0.79 | |
| TKB0144 | 65 | 79 | 14 | 0.5 | 4m @ 0.91g/t Au from 75m (& including 1m @ 1.72g/t Au from 75m) |
| TKB0144 | 96 | 112 | 16 | 0.82 | 6m @ 1.22g/t Au from 101m (& including 1m @ 2.77g/t Au from 101m) & 1m @ 2.15g/t Au from 111m |
| TKB0144 | 150 | 152 | 2 | 0.59 | |
| TKB0146 | 113 | 116 | 3 | 0.92 | |
| TKB0160 | 131 | 133 | 2 | 6.03 | 1m @ 11.5g/t Au from 131m |
| TKB0161 | 176 | 185 | 9 | 1.23 |
1 Note - Not true widths.
2 Note - Primary intervals calculated by applying either a 0.5g/t Au cut-off (minimum 1gram-metre accumulation) OR applying a 0.3g/t Au cut-off (minimum 5gram-metre accumulation) and allowing up to 2m internal dilution in either instance. Included intervals are selected to ensure balanced and representative reporting of mineralisation within primary intervals.
Table 4: Drillhole Collar Details for Historical Drill Holes Mentioned in this Announcement
| Hole ID | Easting | Northing | RL | DIP | TAZ | Total Depth (EOH) | Type | Completion | Target |
| TKB0007 | 476655 | 6546810 | 180 | -60 | 60 | 160 | RC | 24/08/21 | A223 North |
| TKB0008 | 476601 | 6546810 | 180 | -60 | 60 | 160 | RC | 24/08/21 | A223 North |
| TKB0010 | 476568 | 6546880 | 180 | -60 | 60 | 160 | RC | 25/08/21 | A223 North |
| LRC108 | 476469 | 6546934 | 180 | -60 | 59 | 162 | RC | 22/05/97 | A223 North |
| LRC114 | 476316 | 6546843 | 180 | -60 | 59 | 162 | RC | 31/05/97 | A223 North |
| LRC090 | 476846 | 6546342 | 191 | -60 | 59 | 162 | RC | 03/05/97 | A223 North |
| LRC092 | 476793 | 6546311 | 190 | -60 | 59 | 144 | RC | 04/05/97 | A223 North |
| LED004 | 477512 | 6545183 | 192 | -60 | 44 | 290 | DD | 20/03/1997 | 223 |
| LED016 | 477543 | 6545246 | 190 | -60 | 59 | 222.2 | DD | 12/03/2006 | 223 |
| LED017 | 477562 | 6545257 | 190 | -60 | 59 | 220.1 | DD | 9/03/2006 | 223 |
| LED018 | 477582 | 6545269 | 190 | -60 | 59 | 180.1 | DD | 5/03/2006 | 223 |
| LRC013 | 477671 | 6545362 | 195 | -60 | 224 | 180 | RC | 12/11/1996 | 223 |
| TKB0058 | 477389 | 6545227 | 191 | -55 | 58 | 360 | RC | 16/09/2022 | 223 |
Table 5: Significant Intersections for Historical Drilling Mentioned in this Announcement2
| Hole ID | From | To | Metres1 | Au (g/t) | Comments &/or including |
| TKB0007 | 56 | 64 | 8 | 1.44 | |
| TKB0008 | 121 | 137 | 16 | 1.30 | |
| TKB0010 | 51 | 61 | 10 | 3.65 | |
| LRC090 | 71 | 84 | 13 | 1.20 | |
| LRC092 | 96 | 100 | 4 | 2.51 | |
| LRC092 | 104 | 109 | 5 | 2.98 | |
| LRC092 | 128 | 137 | 6 | 1.87 | |
| LRC108 | 53 | 60 | 7 | 1.49 | |
| LRC114 | 131 | 160 | 29 | 0.68 | |
| TKB0058 | 339 | 344 | 12 | 4.04 | |
| LED004 | 181 | 215 | 34 | 1.61 | |
| LED016 | 119 | 154 | 35 | 1.26 | |
| LED017 | 110 | 139 | 29 | 4.14 | |
| LED018 | 66 | 96 | 30 | 3.62 | |
| LRC013 | 102 | 139 | 37 | 3.96 |
1 Note - Not true widths.
2 Note - Primary intervals calculated by applying either a 0.5g/t Au cut-off (minimum 1gram-metre accumulation) OR applying a 0.3g/t Au cut-off (minimum 5gram-metre accumulation) and allowing up to 2m internal dilution in either instance. Included intervals are selected to ensure balanced and representative reporting of mineralisation within primary intervals.
SOURCE: Barton Gold Holdings Limited